Effective Use of Legends and Annotations in Clip Charts
Legends When we talk about legends in the context of data visualization, particularly in charts created using tools like Clip, we are referring to an important component that serves several critical functions. A well-crafted legend is a key to decoding symbols, colors, or patterns used in a chart. Also, it is a guide that aids […]
Integrating Clip with Jupyter Notebooks

Clip is a powerhouse for creating charts and illustrations directly from command-line data. Jupyter Notebooks are the playground of data scientists. They offer a user-friendly interface to run live code, visualize data, and create documents with rich text elements. It’s the go-to tool for exploring, explaining, and sharing data insights. Installing Clip in a […]
Building Pie Charts with Clip
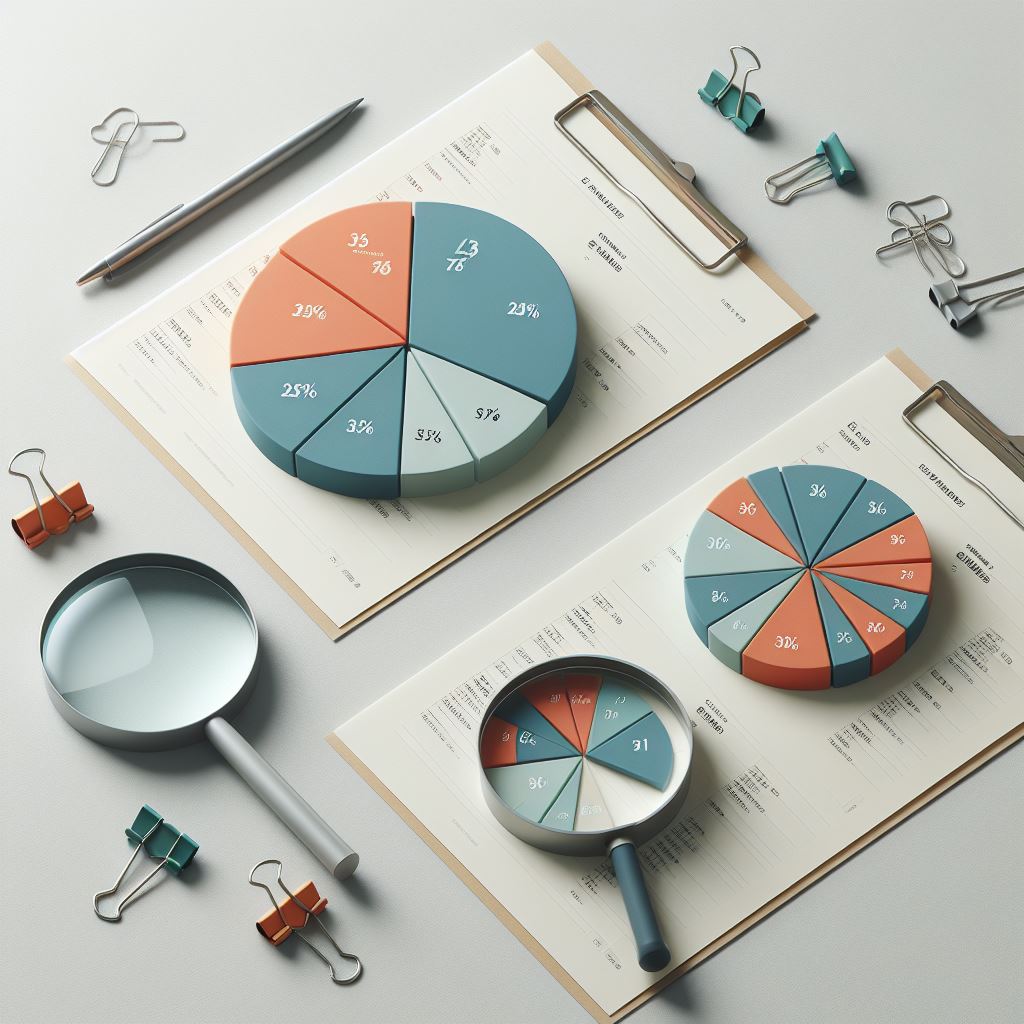
Pie charts are ideal for showcasing parts of a whole – they visually break down what percentages of a total each category represents. They work best when you’ve got a limited number of categories (usually around 2 to 6) and when you’re aiming to give a quick snapshot of how these categories compare proportionally to […]
Creating a Workflow with Clip

As Clip runs on the command line, it requires installation that typically involves package managers. Users must be familiar with command line basics and should have a local environment set up with access to the terminal or command prompt. Installation instructions will vary depending on the operating system, but follow the guidelines provided in Clip’s […]
Choosing the Right Fonts for Your Charts in Clip

Font Characteristics to Consider Fonts should be clear and simple to read across various applications. This is particularly vital for data visualizations, where conveying information accurately is the main objective. Fonts with straightforward, clean lines tend to maintain their legibility even when scaled down to fit the small spaces often seen in charts and graphs. […]
Plotting Geographic Data with Clip

Positioning Data Geographically To engage in geographical positioning with software such as Clip, you begin by ensuring your data includes geographic coordinates. These coordinates should be present in your dataset as separate fields or columns, usually labeled with terms like ‘lat’ for latitude and ‘long’ for longitude. Latitude values indicate how far north or south […]
Custom Themes in Clip
The command line may seem an unlikely place to ply the craft of brand alignment, but with Clip, flexibility is at your fingertips. The first step towards customizing your charts is to identify your brand’s colors. Often, these are found in the company’s style guide or branding materials. If you don’t have access to these […]
Creating Bar Charts with Clip

Before start crafting bar charts, ensure you have Clip installed on your system. It’s an open-source tool, available on platforms like GitHub, and installing it usually involves running a few commands in your terminal or command prompt. Once Clip is ready to go, gather the data you intend to visualize. Clip works with various data […]
Advanced Line Graphs in Clip
Elevate Your Data Stories with Detailed Line Graphs A sophisticated line graph can illuminate subtle shifts that could be overlooked in tables or simpler charts. With such detail, your audience grasps the nuances of your data’s fluctuations and patterns. This depth can lend significant weight to your analysis, enabling viewers to perceive the narrative underpinning […]
Localization and Internationalization with Clip

Internationalization (I18n) is the design and development of a product, application, or content that enables easy localization for target audiences that vary in culture, region, or language. Localization (L10n) involves adapting the internationalized content to suit the specific needs and preferences of a local audience, which includes translating text and adapting graphical elements to cultural […]