Localization and Internationalization with Clip

Internationalization (I18n) is the design and development of a product, application, or content that enables easy localization for target audiences that vary in culture, region, or language. Localization (L10n) involves adapting the internationalized content to suit the specific needs and preferences of a local audience, which includes translating text and adapting graphical elements to cultural […]
Scaling Clip for Large Data Sets
Efficient Data Handling The choice of storage solutions for large datasets has a direct impact on the system’s I/O efficiency. Formats like Parquet and HDF5 are crafted for quick data access, particularly when dealing with columnar data, which is common in machine learning tasks. When data is accessed frequently and speed is important, these formats […]
Leveraging Clip for Machine Learning Data Visualization
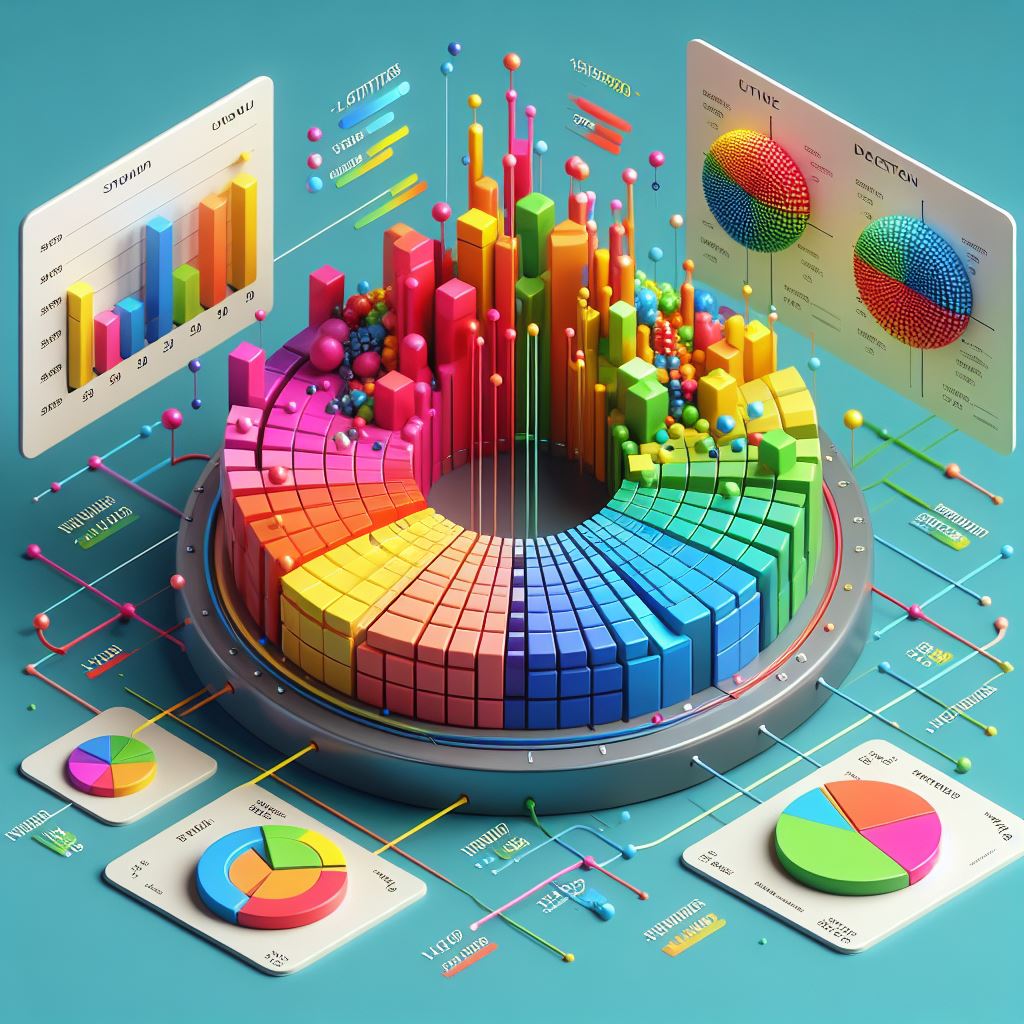
Machine learning is data-centric—algorithms learn from data, adjust to new data, and make decisions based on data. Visualizations help us understand the data itself, including its features, distribution, and the relationships between different variables. Clip emerges as an unorthodox yet potent command-line tool proficient in rendering illustrations. Its simplicity and scalability make it an ideal […]
Using Clip in Academic Research

Artificial Intelligence (AI) has inaugurated a renaissance across various sectors, and academic research is no exception. The implementation of AI in data visualization tools like CLIP presents scholars with unprecedented capabilities. CLIP’s algorithm, trained on a vast corpus of images and corresponding text, can generate visuals from descriptions with uncanny accuracy—akin to having an illustrator […]
Clip Scripting

Clip Scripting refers to the use of a scripting language within an illustration or design program, accessed via a command line interface (CLI), to perform repetitive tasks, apply uniform styles, or even generate assets as a batch. These scripts are composed of a series of commands and can be simple, affecting single operations, or complex, […]
Creating Accessible Charts with Clip
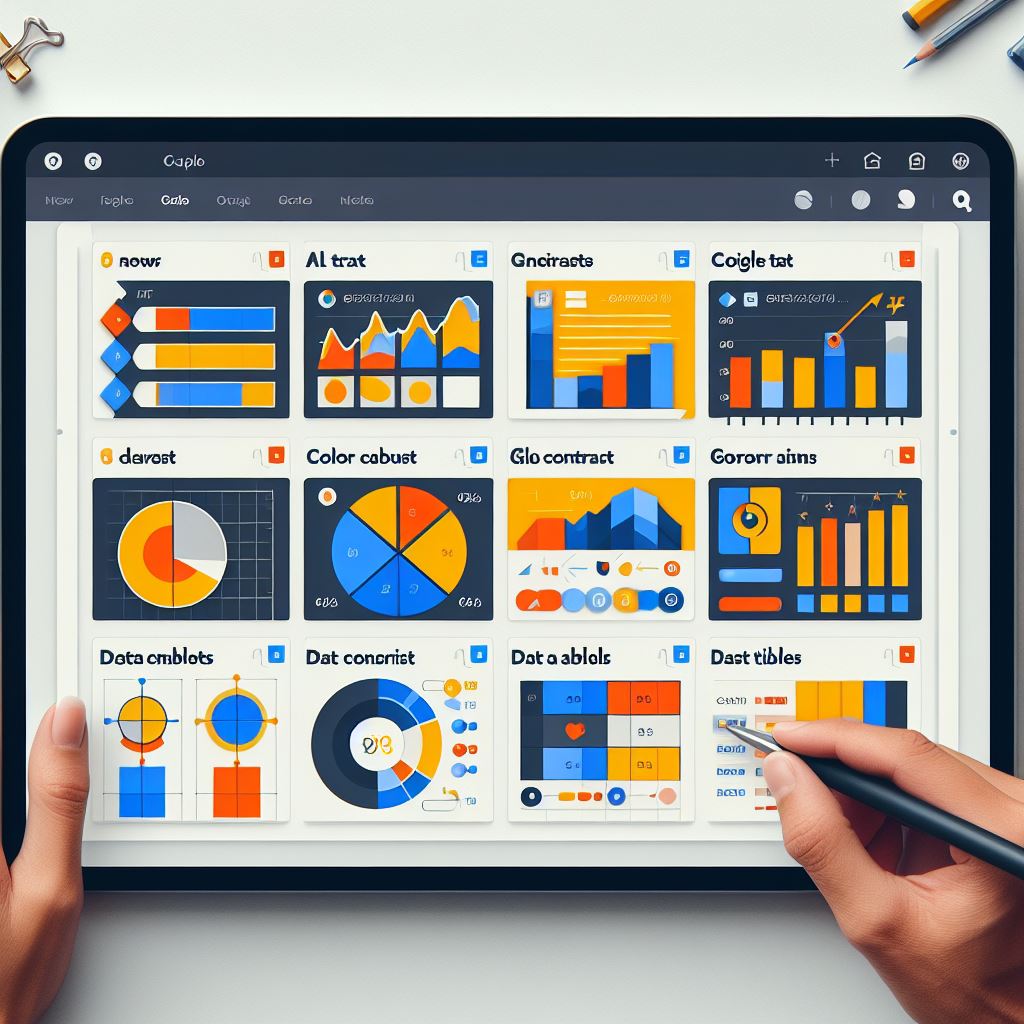
Accessibility in chart design it’s about creating an environment where all users have equal access to information. Visual impairments, color vision deficiencies, and cognitive disabilities can all impact how a person interacts with a chart. When we fail to take these into account, we sideline those individuals from the discourse that data can ignite. […]
Clip vs. GUI
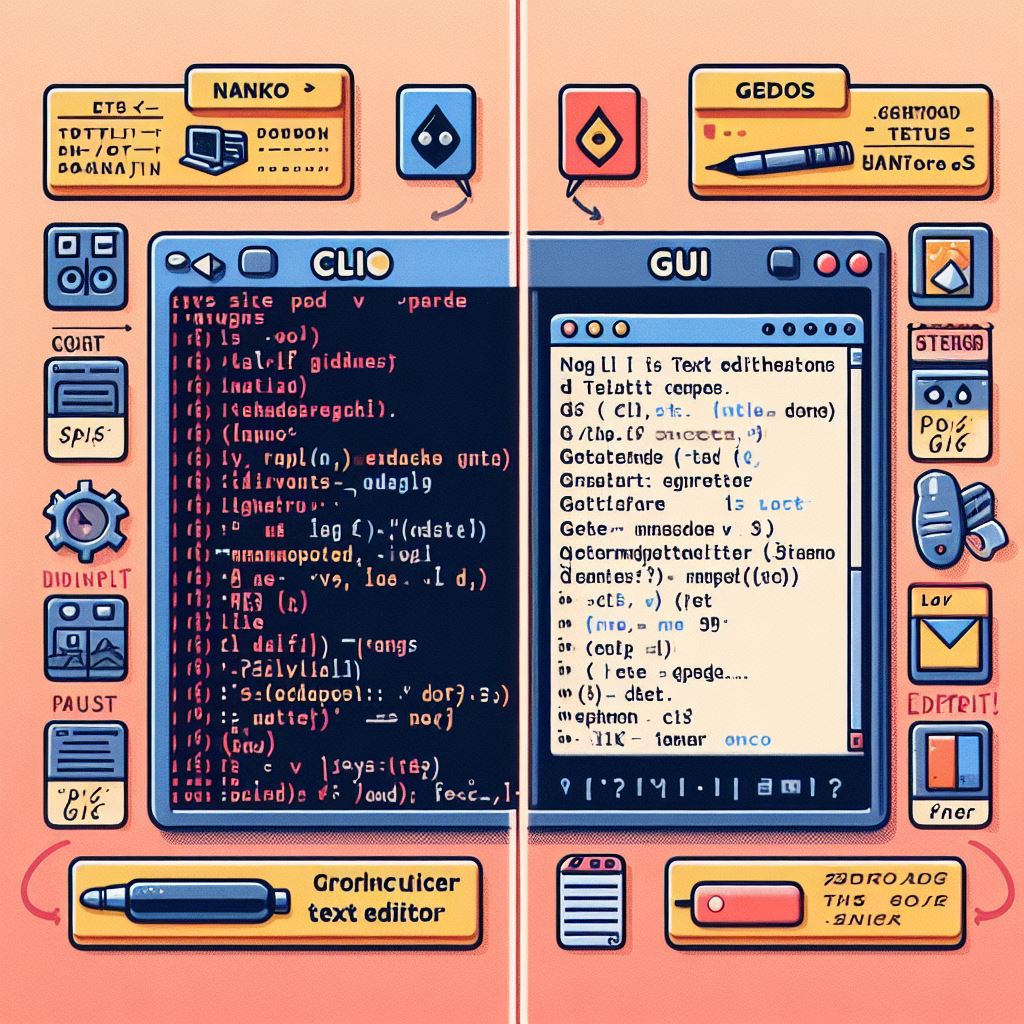
A GUI is a user interface that includes graphical elements such as windows, icons, and buttons, allowing users to interact with electronic devices through simple, intuitive actions. Its useful visual cues, make it accessible to users of all levels. A CLI like ‘clip’ is a text-based interface where commands are typed on a keyboard. It […]
An In-depth Q&A about CLIP Features

What is CLIP? CLIP is an invaluable tool in the toolbox of anyone who desires to integrate visual elements into their workflow without leaving the sphere of their terminal workspace. It transforms simple, written commands made up of understandable, user-friendly language into complex, visually-oriented outputs. These outputs can range from insightful data representations like charts, […]
Streamlining DevOps with Command-Line Illustration Processing
In the realm of automation, illustration work has often been left in the hands of designers and developers, with many relying on manually intensive tools and applications to edit and process visual assets. This approach stands in opposition to the principles of a robust DevOps strategy which thrives on automating repetitive and predictable tasks to […]
Unlocking the Power of SVG with Command-Line Mastery
Every SVG is a structured XML document that describes the geometry and styling of vector-based graphics. While this description may initially appear perplexing, especially to those accustomed to the intuitive point-and-click environment of graphical interfaces, the simplicity and elegance of SVG code become clear with exposure and practice. Transitioning to command-line tools for creating SVGs […]